Enterprise Reporting Software: Ready-Made Vs Custom-Made Solutions

Enterprise reporting software is an important part of a company’s IT ecosystem. It provides employees with critical information they need, when they need it, facilitating data-driven decision-making.
In the following article, we are going to look at different types of enterprise reporting solutions, starting with ready-made products and diving into various customization options available to users.
What is Enterprise Reporting?
Enterprise reporting is the process of creating reports that provide actionable insights to key decision-makers. When done correctly, such reports can help increase productivity, enhance decision-making, and improve business operations efficiency.
Key features of modern enterprise reporting include interoperability, data integration, customization capabilities, and the freedom to choose from multiple output formats.
Enterprise Reporting Software Use Cases
To paraphrase a well-known parable, ‘so many companies, so many reporting needs’. Depending on the industry, the size, and the specialization of the company in question, it will have its unique reporting needs and will choose from available business reporting solutions accordingly. However, there are certain types of reports that are widely used across enterprises. Let’s look at the most common use cases:
Financial Reporting. Companies are about money, so every big firm needs accounting and financial reporting software to keep track of revenue, expenses, profits, and other financial data.
Sales and Marketing Reports. They contain sales and marketing data such as sales statistics, advertising costs, campaign metrics, KPIs by marketing/sales channel, and more. When it comes to forecasts, it could be market insights, industry trends, and predictive analytics.
Customer Analytics. Most enterprise companies use some kind of CRM (customer relationship management) system to gauge valuable data points related to their client base. As a rule, CRM reports provide insights that have to do with user demographics and behavior.
Project Management Reporting. Big companies use project management software to organize work around various projects and initiatives. It could be an IT project management system, incident tracking software, a helpdesk solution, and so on.
Human Resources Reports. Depending on the nature of one’s business, their human resources (HR) reports may incorporate different data, e.g., employee performance metrics, data related to job and exit interviews, and employee engagement dynamics.
Security and Compliance Reporting. Security can mean different things depending on the firm: keeping people and assets safe, preventing cyberattacks, etc. Plus, big companies are subject to tons of rules and regulations, so some create a compliance department, while others buy ready-made compliance solutions, or do both.
Procurement and Supply Chain Management. “Procurement” is about acquiring stuff that your business needs, while “supply chain management” covers the entire manufacturing cycle from sourcing raw materials to delivering goods to the end-user. Businesses that make physical products usually have a supply chain management solution in place that generates reports.
Ready-Made Enterprise Reporting Software
The world of ready-made enterprise software is vast. Each of the seven use cases we just mentioned is covered by dozens, if not hundreds, of specialized SaaS solutions. So we are talking about at least a thousand enterprise reporting tools, the majority of which are popular and widely used by their target audiences. Hence, it would not be feasible to review them all within the scope of this article.
At the same time, there is a group of so-called “business intelligence reporting tools,” which enterprise companies often use to bring together different types of analytics. These instruments let you extract stats from disparate sources (e.g., your MS Excel spreadsheets, accounting software, etc.) and crunch these data in one place to get a bird’s eye view of your company’s analytics across the board.
So let’s look at some of the popular ready-made solutions in this category (listed in alphabetical order).
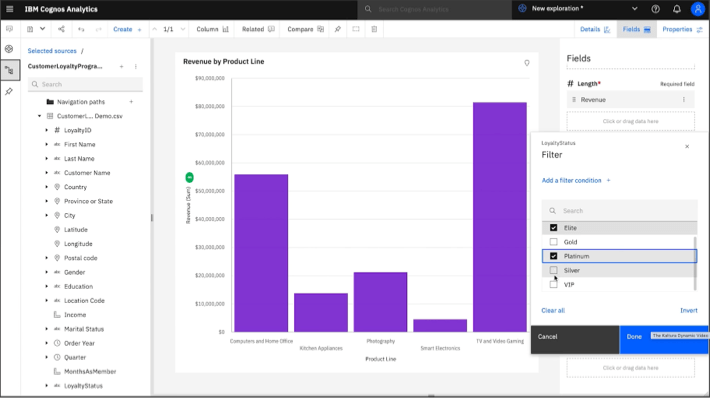
1. Cognos Analytics by IBM
Industries: Finance, Healthcare, Retail, Manufacturing, Government & Public Sector, Education, Telecommunications, Energy & Utilities, Insurance, Transportation & Logistics
IBM Cognos Analytics is a comprehensive business analytics solution and a major player in the field. The enterprise reporting platform boasts AI-infused insights, predictive forecasting and convenient data exploration, meaning you can use the help of the natural language AI assistant to get answers to your questions. It also allows users to build advanced customizable reports and dynamic dashboards. Business clients can deploy Cognos on the cloud of their choice (including IBM Cloud) or on-premises.
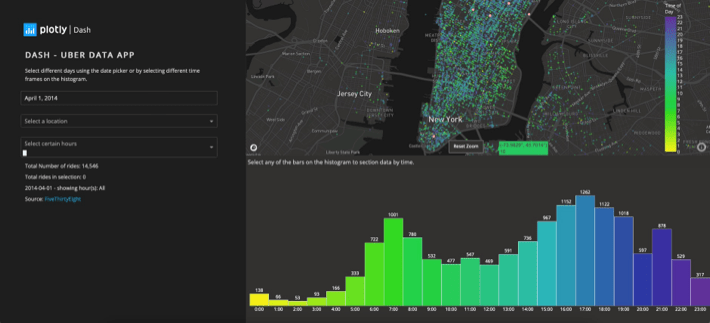
2. Dash Enterprise by Plotly
Industries: Aerospace, Automotive, Energy, Finance, Manufacturing, Medical Imaging, Pharma, Retail, Sports Analytics
Dash Enterprise is a data app platform for Python that allows data scientists to “put complex Python analytics in the hands of business decision-makers.” Plotly’s philosophy is that classic business intelligence apps aren’t enough in today’s AI-powered world. Its Dash Open Source framework and Dash Enterprise platform allow analysts to leverage low-code Python data apps for more sophisticated data plotting and insights mining. The platform’s Reporting Engine uses machine learning to help users see patterns in and make predictions from their analytics.
3. Domo
Industries: Retail, Financial Services, High Tech, Manufacturing, Media & Entertainment, Healthcare, Professional Services, Hospitality & Travel, Education
Domo is a business intelligence platform that contains analytics, data creation and app creation tools. Domo.AI invites users to re-imagine BI reporting with automated writing tasks, the ability to ask questions in plain language, and alerts for important data changes. Besides, Domo allows business users to choose from over 150 chart types for data visualization purposes and embed analytics within end-products in a style-agnostic manner through Domo Everywhere.
4. Strategy One
Industries: Retail, Financial Services, Healthcare, Government, Technology
Strategy One is an AI+BI analytics platform with robust reporting and data visualization capabilities. The platform’s microservices architecture makes integrating with business apps easy and facilitates the free flow of information across data silos. The Auto feature allows users to interact with AI chatbots to create reports, visualizations, or data apps. Strategy One’s HyperIntelligence service lets you embed relevant data into emails, web pages, and applications, enabling users to view contextual data when they hover over highlighted keywords.
5. Oracle Analytics
Industries: Financial Services & Banking, Retail & E-Commerce, Healthcare, Manufacturing, Telecommunications, Government & Public Sector, Energy & Utilities. Education, Transportation & Logistics, Hospitality & Travel
Oracle Analytics is a powerful BI platform that helps big organizations derive insights from data gathered across business functions. It offers features like pre-built data models and visualization cards, and the ability to query the app by asking questions using text or voice. As a unique offering, it provides explanations of the factors that influenced a machine learning model to predict a particular outcome. In addition to pre-built visualizations options (basic charts, advanced visualizations, geospatial mapping and AI-powered insights), Oracle Analytics can also embed reports from third-party BI tools, including Tableau, Power BI, and Qlik Sense. It can be deployed as Oracle Analytics Cloud or Oracle Analytics Server.
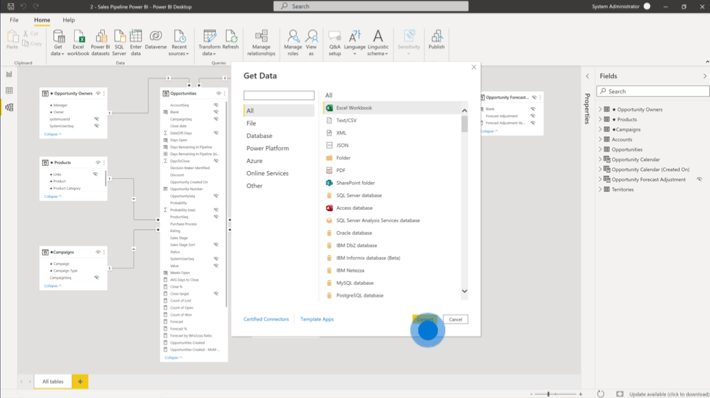
6. Power BI by Microsoft
Industries: Banking, Retail and eCommerce, Logistics, Education, Government and Public Sector, Energy, IT, Healthcare, Media
Power BI is one of the oldest BI analytics tools on the market. It started as an Excel add-on in 2010 and became a standalone product in 2015. Like other enterprise report management platforms, Power BI lets you turn data into visuals. The solution comes with the OneLake data hub that lets you have all your datasets in one place, and offers a smooth integration with Microsoft Fabric, Microsoft’s AI-powered end-to-end analytics product. Visuals produced by Power BI can be used by your team internally or embedded in an application through an API. REST APIs are available for custom integrations.
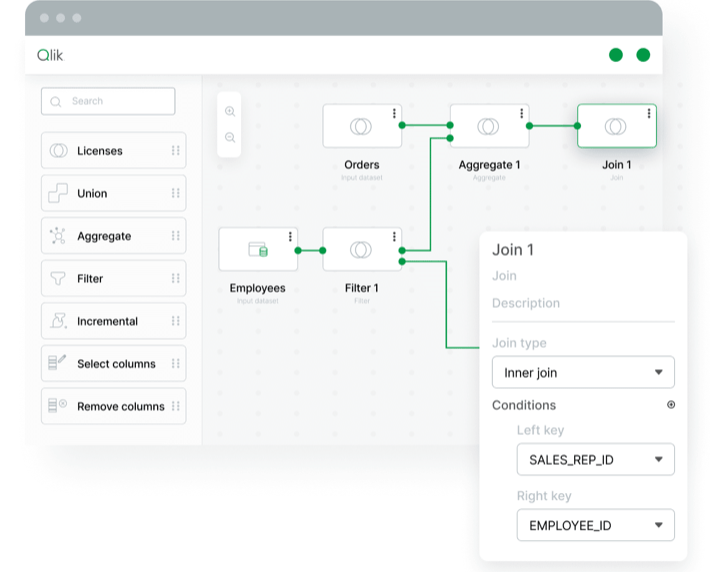
7. Qlik Talend and Qlik Analytics
Industries: Finance, Healthcare, Public Sector, US Government, Retail, Communications, Manufacturing, Consumer Products, Energy, High-Tech, Life Sciences, ISV
Qlik Talend is a data integration solution by Qlik that allows you to bring together virtually any kind of data thanks to the platform being cloud-independent and technology-agnostic. Once you prepare AI-ready and analytics-ready data with Qlik Talend, you can then build visualizations and reports in the Qlik Analytics product. Qlik Analytics leverages natural language interaction, predictive analytics, and generative AI to produce valuable insights for decision-makers.
8. SAP BusinessObjects
Industries: Financial Services & Banking, Retail & E-Commerce, Healthcare, Manufacturing, Telecommunications, Government & Public Sector, Energy & Utilities, Education, Transportation & Logistics, Hospitality & Travel
The product’s full name is “SAP BusinessObjects Business Intelligence suite”. The platform offers data analytics, self-service visualization and enterprise reporting tools that help corporate users make informed decisions based on real-time insights. When it comes to integrating with other sources, SAP BusinessObjects connects to SAP Business Warehouse and SAP HANA, integrates with MS Excel, and allows you to embed analytics in MS PowerPoint.
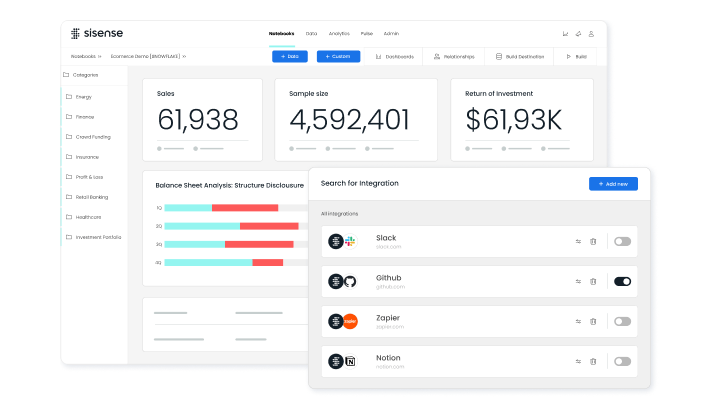
9. Sisense
Industries: Healthcare, Financial Services & Banking, Retail & E-commerce, Manufacturing & Supply Chain, Technology & SaaS, Telecommunications, Government & Public Sector, Media & Entertainment, Education
Sisense is an AI analytics platform that has all the features one would expect in a modern BI product: AI-powered data preparation tools, 400+ data connectors available out of the box, and intuitive data exploration powered by generative AI. In addition, Sisense offers Compose SDK, a toolkit that lets developers embed analytics in a code-first, modular way.
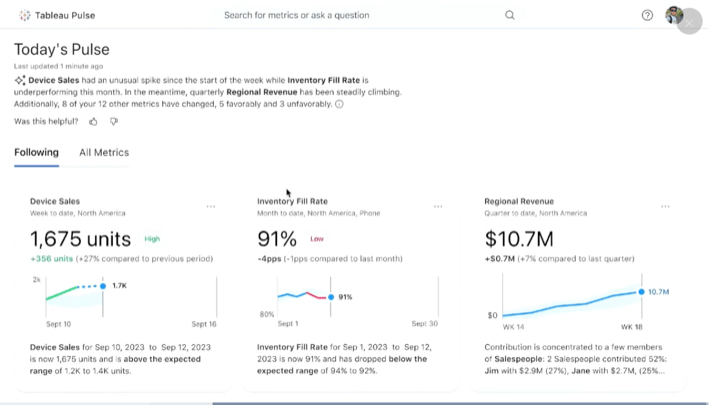
10. Tableau for the Enterprise
Industries: Finance, Healthcare, Public Sector, Retail and Consumer Goods, Communications and Media
Tableau is widely regarded as one of the top players in the BI reporting space. Since Tableau is now a Salesforce company, its software incorporates certain capabilities from relevant Salesforce products under the hood. Judging by the demo video, users get Einstein-powered AI features, an integration with the Customer 360 CRM, and other cool bonus features. Visualization is where Tableau shines best: even without much coding experience, you can use the platform’s drag-and-drop interface to create charts that contain the insights you need.
Custom-Made Enterprise Reporting Solutions
If you look at the above reporting tool comparison, you’ll notice that the solutions presented there offer more or less the same capabilities. Ready-made reporting tools are sometimes “bloated” with features: the vendor tries to foresee every possible demand under the sun to attract a maximum number of potential clients. But what your reporting needs are very unusual or perhaps rather modest? In this case, you might want to consider developing a built-to-order enterprise reporting system.
We have written a detailed article about the pros and cons of buying vs. building enterprise software, and we invite you to check it out. We don’t claim that either approach is the right one—in the end, it boils down to the following considerations:
- Compare the total cost of ownership (TCO) of both the ready-made and the custom-made solution.
- See if the ready-made product has all the core features you need.
- Check if the ready-made solution can be extended/built upon through API access.
- If you go with a custom-made product, have a solid maintenance plan in place (99% of custom-built software requires ongoing maintenance after it was launched!)
- Compare the learning curve and the ease of adoption of various enterprise reporting solutions.
In most cases, developing a complex BI reporting solution from scratch doesn’t make sense: it’s costly and, by the time you finish building it, your goalposts may have changed. Here at ObjectStyle, we observe that the following use cases are often the focus of customization:
- Integrating ready-made enterprise solutions with one another.
- Extending the functionality of out-of-the-box products.
- “Marrying” custom-built software with ready-made products.
Looking for a reliable custom enterprise software developer? Contact ObjectStyle—we have a ton of experience working with large companies!
Implementing Enterprise Reporting Software: Best Practices
While it’s hard to talk about enterprise reporting best practices in a one-size-fits-all manner, let’s look at the steps big companies typically take to implement reporting in their organizations.
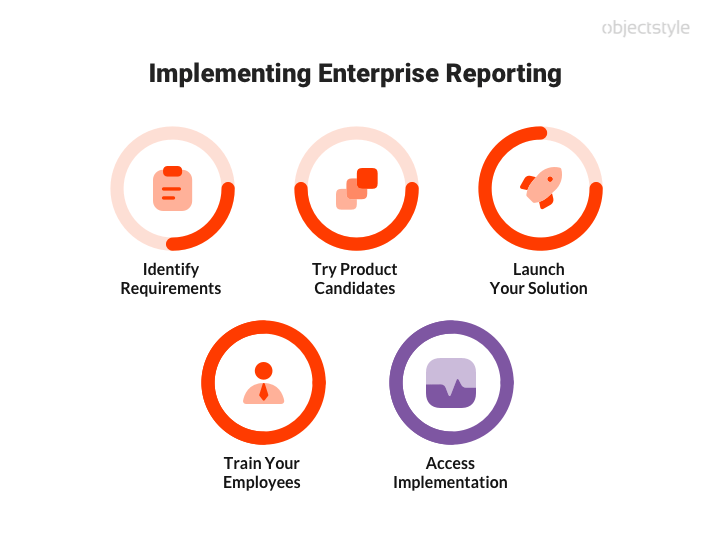
1. Identify Your Requirements
The first thing to do is to understand what data should be present in reports, where it comes from, and how it should be prepared. You should also determine who will be responsible for data management and who the reports will be intended for. Remember to analyze technical and legal requirements such as the level of data protection and security you need, as well as any compliance issues you may run into.
2. Try Product Candidates
Once you know what you need, you can either look for a ready-made solution to cover your requirements, or engage with a developer to create a tailor-made solution. The former refers to taking the product for a “test drive,” whereas the latter refers to going through the Discovery phase and developing a Proof of Concept product to see how it meets your requirements. It’s always a good idea to gather feedback from a focus group of people who will be actually using the system.
3. Customize and Launch Your Solution
When you have decided which solution you will use, it’s time to set it up and release it to production. The “setting up” part consists in connecting the data sources and databases/environments, customizing the BI platform to your needs (if necessary), preparing default report templates, and possibly other activities.
4. Train Your Employees
For the implementation to be a success, you need a robust change management framework in place to facilitate the adoption of the new solution by the very users it’s meant for. Some ready-made product vendors give you a hand with the onboarding process with explainer videos and help materials, or outright training programs. When training the solution’s end-users, make sure they know how to use its most valuable/advanced features.
5. Assess Implementation Success
Give it some time and then see how well the implementation went by measuring relevant success metrics. Those metrics can be aligned with your initial goals for the project. Is the solution helping users achieve those goals? Are they making use of the most important features? Did productivity, decision making, or other important KPIs improve after the implementation? But eventually each company will have its own KPIs.
Conclusion
Enterprise reporting tools are powerful integration platforms that let you unite data from disparate sources in one place. Many such solutions are developer-friendly and let you tweak data pipelines to your needs or build on them. When selecting an appropriate solution, you can consider a top ready-made BI reporting product or create your own. Whatever you opt for, having a solid implementation process will help you make the most of enterprise reports.
Related Blogs

25 Content Management Systems for Enterprise Companies
LEARN MORE
